
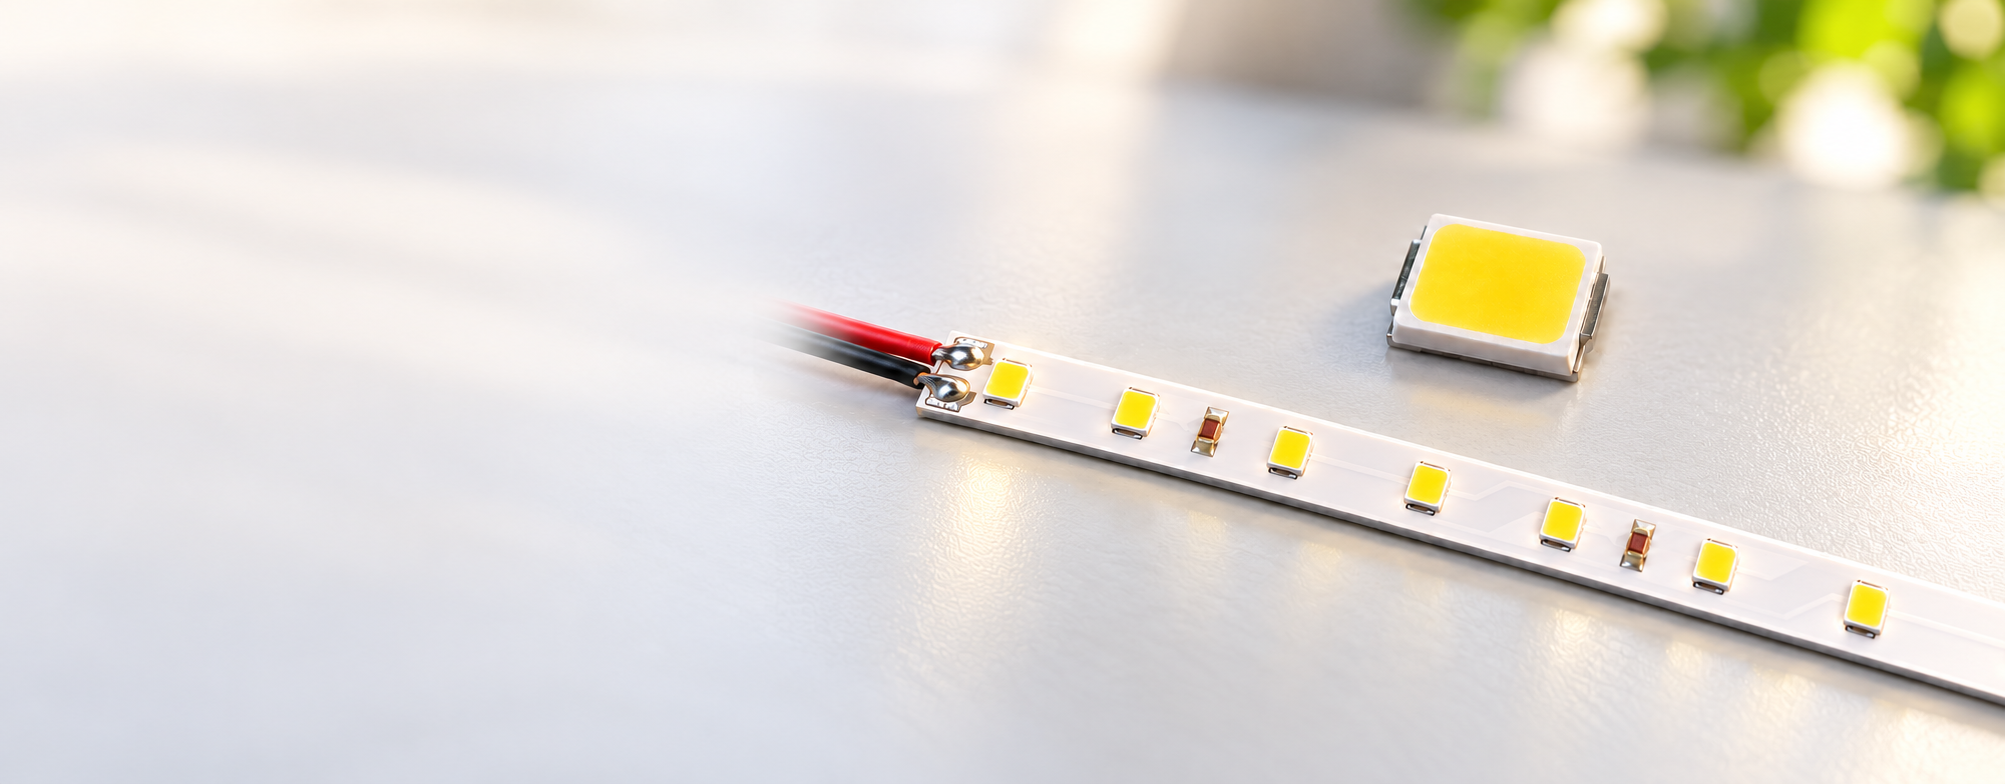
Can an LED package result of approximately 213 lm/W be used as the efficacy of a bare LED board? It cannot be substituted directly. First identify the test object, the electrical input boundary and the test conditions.
This guide uses three records from a 2835 LED package report and one bare rigid LED board report to explain luminous flux, power and lm/W. Each report describes its own test sample; they have not been established as a matched test using the same LED batch.
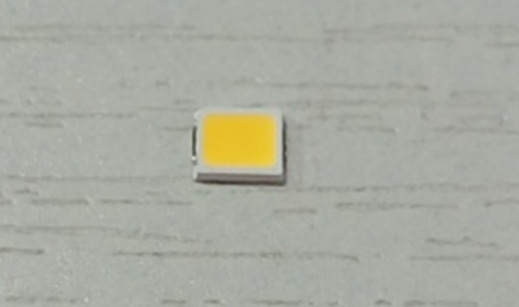
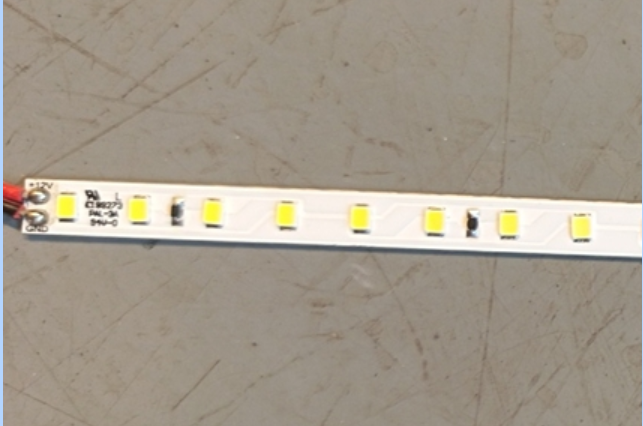
2835 LED package supplied with the test records. Bare rigid LED board, without a diffuser or enclosure.
1 What each efficacy figure describes
LED package efficacy describes the luminous flux per watt of electrical input for a single LED package at the reported voltage, current and test conditions. Bare-board efficacy describes the assembled board, including its LEDs and onboard circuit, using the input power reported for that sample.
These are component-level and board-assembly-level results. When purchasing a bare LED board, use a report for the actual board rather than substituting a package supplier’s efficacy figure.
2 How luminous efficacy is calculated
Efficacy in lm/W = luminous flux in lm ÷ electrical input power in W
Convert milliwatts to watts first: 1000mW equals 1W. The first package record lists 161.9mW, or 0.1619W.
Recalculating from the displayed values gives 34.46 ÷ 0.1619 ≈ 212.85 lm/W, while the report lists 212.88 lm/W. For the board, 420.27 ÷ 2.448 ≈ 171.68 lm/W, while the report lists 171.69 lm/W. Display precision can produce small differences when values are recalculated; efficacy figures quoted here follow the PDFs.
3 The actual results in the two reports
The three-page package report identifies model 2835 W 4985±175K, number 30101-0568-00. The bare-board report identifies B008084BB1LZ(SMP0025), number 10201-0368-00, with a sample size of 579×8mm.
| Test object | 2835 record 1 | 2835 record 2 | 2835 record 3 | Bare LED board |
|---|---|---|---|---|
| Date | 2026-06-15 | 2026-06-15 | 2026-06-15 | 2026-06-18 |
| Flux | 34.46 lm | 34.54 lm | 34.71 lm | 420.27 lm |
| Power | 161.9 mW | 161.6 mW | 162.1 mW | 2.448 W |
| Voltage | 5.400 V | 5.390 V | 5.414 V | 12.00 V |
| Current | 29.98 mA | 29.98 mA | 29.94 mA | 0.2040 A |
| Efficacy | 212.88 lm/W | 213.70 lm/W | 214.12 lm/W | 171.69 lm/W |
| CCT | 5122 K | 4874 K | 5008 K | 4969 K |
| Ra | 96.2 | 96.6 | 96.4 | 96.0 |
| Ambient | 25.3°C | 25.3°C | 25.3°C | 25.3°C |
The three package records range from 212.88 to 214.12 lm/W. The bare board records 171.69 lm/W. Its 420.27lm and 2.448W apply to the tested 579mm sample; they must not be labeled lm/m or W/m. The lm/W ratio is not a per-meter quantity.
The board report supports the statement: “This bare rigid LED board sample measured 171.69 lm/W, with a measured CCT of 4969K and Ra96.0, under the reported conditions.” It does not establish a universal guarantee for every model, batch or operating condition.
4 Why package efficacy cannot replace board efficacy
Connecting package data to a board requires confirmation of LED specification and batch, actual drive current, onboard circuit, thermal arrangements and test state. The package operating point may differ from its operating point on the board, and the board input includes the relevant circuit’s electrical load. These are factors to verify, rather than quantified causes established by these two reports.
The samples have not been confirmed as a same-batch, same-operating-point pair. The difference between approximately 213 lm/W and 171.69 lm/W therefore cannot be presented as a measured manufacturing loss. Their ratio is not an established conversion efficiency for this board.
5 Align the comparison before reviewing quotations
- Test object: a single package or the bare board actually being quoted?
- Power boundary: where was input power measured, and what does it include?
- Operating conditions: are voltage, current, ambient conditions and thermal mounting defined?
- Light quality: do CCT, Ra and, where required, R9 meet the specification as well?
- Test state: when was the reading taken after switch-on, and how was stability assessed?
- Sample identity: do model, dimensions and test date correspond to the quoted and sampled version?
Both reports list an ambient temperature of 25.3°C. That does not establish the same LED junction temperature or thermal mounting conditions. Fields marked T=100ms or T=358ms also do not, by themselves, establish the light-on stabilization period.
6 What to request from a supplier
Request a bare-board report for the quoted model, including sample identity and dimensions, luminous flux, voltage, current, input power, efficacy, measured CCT, color rendering and test conditions. To investigate the package-to-board difference, also request LED traceability, circuit configuration and operating-point information.
In this example, each report provides checkable sample data. Use those results within their stated scope, then decide what further validation is needed for the purchasing decision.
Assessing efficacy and light quality for a bare LED board?
Send your dimensions, voltage, CCT, color-rendering requirements and installation conditions. iPixel LED can help identify a suitable configuration and supporting test information.inquiry@ipixelleds.com
Source reports
All quoted numerical results follow the supplied original PDFs and their displayed precision.